

Computes how sound from noise sources such as construction machinery spreads, including shielding and diffraction by buildings. Place noise barriers to test their effect.
Steps
- In 解析追加 choose 騒音解析 (noise) and a case (Running an analysis).
- Press 地図上で条件を設定, draw the analysis area and place at least one noise source. Add barriers and add or exclude buildings if needed. The map steps (source types, the machinery list, drawing barriers) are in Setting conditions on the map.
- Press 確定, enter the conditions and press 計算開始.
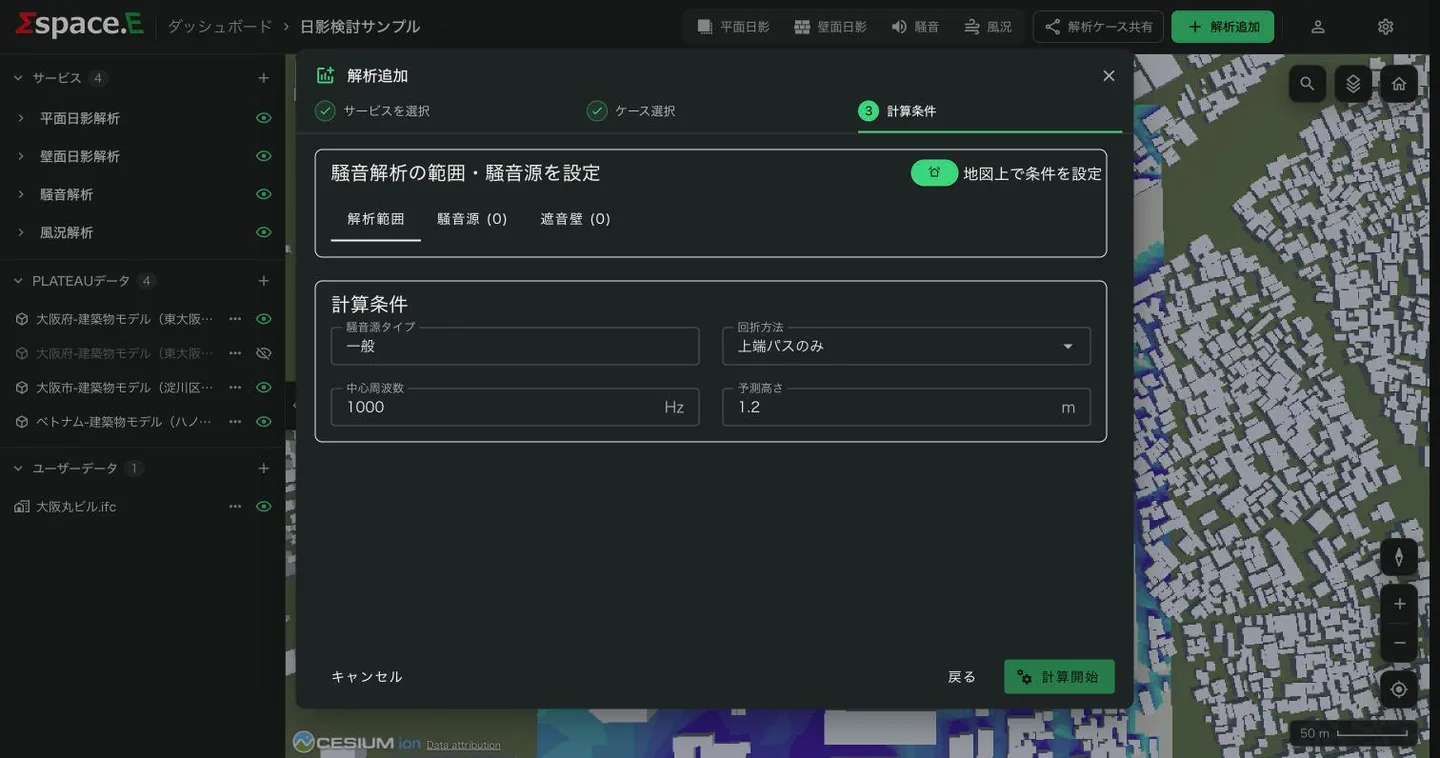
Conditions
| Item | Default | Allowed | Meaning |
|---|---|---|---|
| Noise source type | Automatic | — | Set by the sources you placed (General / ASJ CN-Model 2007) |
| Diffraction method | Top path only | Top path only, insertion loss | How sound bending around buildings and barriers is computed |
| Center frequency | 1000 Hz | 63–8000 Hz | Frequency of the source sound. General sources only |
| Receptor height | 1.2 m | 0–200 m | Height above ground where the noise level is computed |
計算開始 is available once there is an analysis area and at least one source.
Notes
As also shown on screen:
- The instantaneous noise level (LA) is computed. Equivalent (LAeq) and percentile (LAN) levels are not.
- Calculations use the published city model, so they can differ from real conditions.
- After city-model updates, some places may be computed with buildings that differ from those displayed.
- Some places may not be computable.
- Diffraction by terrain, ground absorption, air absorption and reflections are not taken into account.
- Intended for outdoor levels; values inside buildings are not accurate.
Results
The case and these layers appear under サービス → 騒音解析:
- Noise level: the noise level (dB) at the receptor height, by colour. By default 30–85 dB in 12 steps.
- Noise sources and barriers: what you placed.
- Extent: the outline of the analysis area.
Click a result on the map to see its value (for example 34.1 dB). To change the colours, see Editing display styles.