

Opening a project shows buildings and analysis results on a 3D city model.
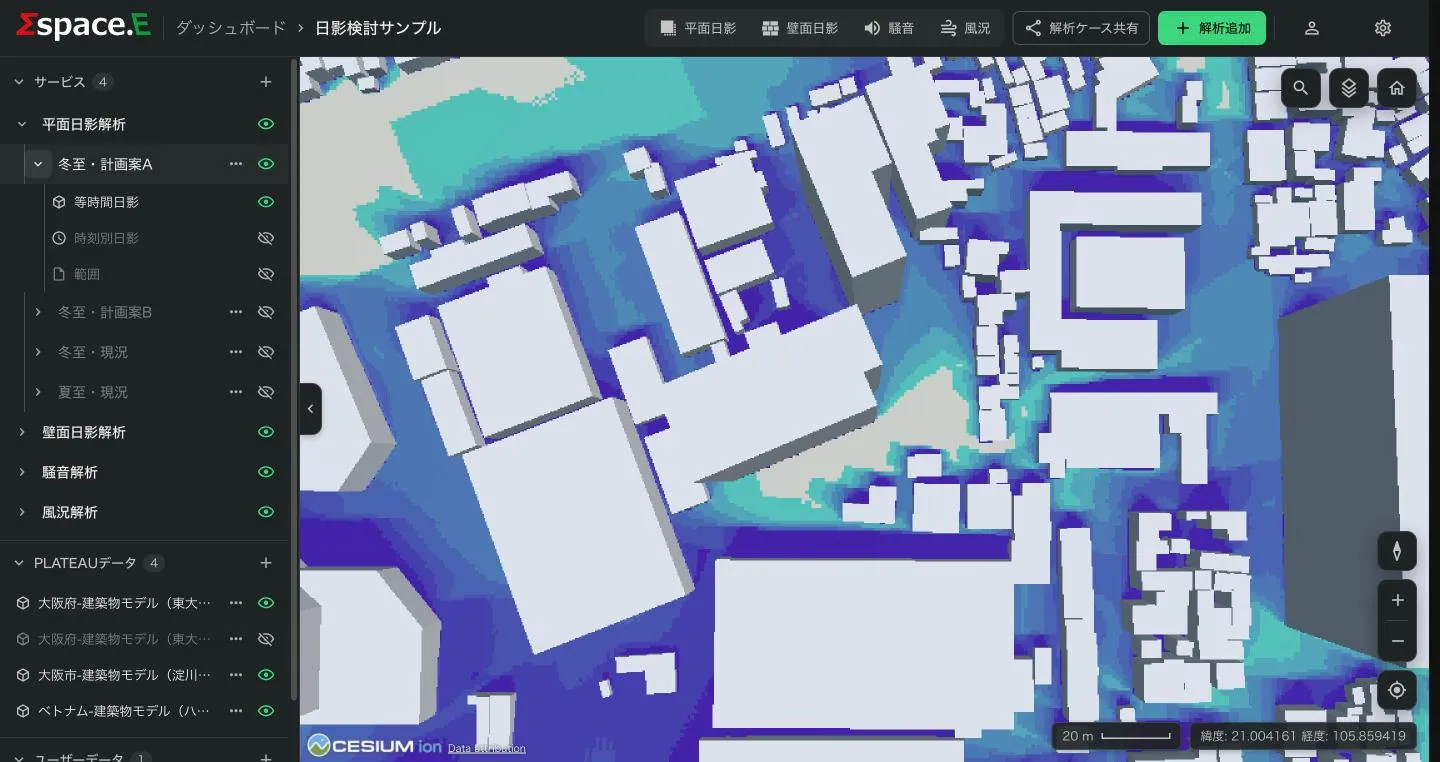
- Top bar
- Switch display per analysis type with the four toggles. 解析ケース共有 shares a case (Sharing); 解析追加 adds an analysis (Running an analysis).
- Services
- Tree of analysis type › case › result layers (e.g. shadow hours, hourly shadow, area). The eye icon shows or hides each.
- PLATEAU data
- Loaded 3D city models. Add more with + (Adding data).
- User data
- Building models you uploaded (IFC etc.).
- Right-hand controls
- Place search, base map, home view, compass, zoom, current location.
Collapse the left panel with the tab on its edge. Drag to pan, scroll or right-drag to zoom, middle-drag (or Ctrl + drag) to tilt and rotate.