

There are two places to set colours, depending on what you are styling.
| What | How to open | Where |
|---|---|---|
| Analysis results (shadow, noise, wind) | Case row under サービス → ⋯ → 3Dタイルスタイルエディタ (3D Tile Style Editor) | Dialog |
| PLATEAU buildings | PLATEAUデータ row → ⋯ → スタイル (Style) | Right-hand panel |
| Uploaded 3D Tiles, SHP, GeoJSON | ユーザーデータ row → ⋯ → スタイル (Style) | Right-hand panel |
Styles are saved on the server per case or per data item, so everyone who opens the project sees the same colours.
IFC and GLB models have no colour settings; their ⋯ menu offers モデルの配置 (Model placement) instead (Adding data). SHP and GeoJSON only offer スタイル once they have been converted to 3D Tiles.
Colouring analysis results
3Dタイルスタイルエディタ appears in the ⋯ menu only for completed cases.
- Pick a ramp under カラーランプ (Color ramps). The left end colours the minimum, the right end the maximum. Besides the per-analysis defaults (shadow, noise, wind) there are about 30 common ramps. For your own two colours, choose カスタムカラー範囲 (Custom color range) at the end and set the start and end colours.
- Under 値の範囲 (Value range), enter the minimum, maximum and ステップ数 (number of steps, a whole number from 0 to 20); the colour breaks are generated for you.
- 全体透明度 (Global opacity) sets how see-through the result is: 0.0 transparent, 1.0 opaque.
- Fine-tune individual breaks under カラーマッピング (Color mapping). Each row means "this colour for values at or above this value". 追加 (Add) inserts a row and the delete button removes one (up to 15 rows). The last row, デフォルト (Default), colours values below every break and cannot be deleted.
- Press スタイル適用 (Apply style) to save and show it on the map.
リセット (Reset) returns to the analysis's default colours.
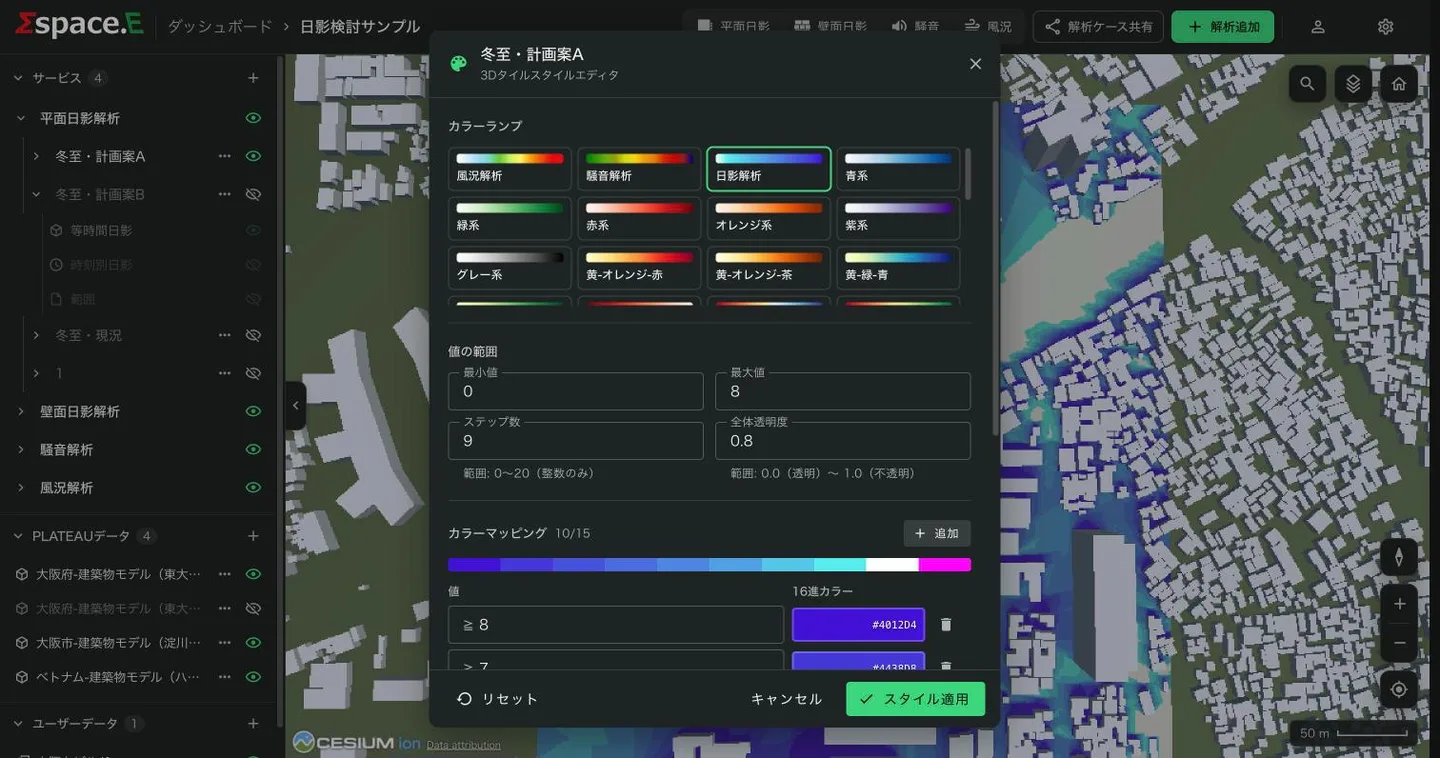
| Analysis | Min–max | Steps | Opacity |
|---|---|---|---|
| Ground and wall shadow | 0–8 (hours) | 9 | 0.8 |
| Noise | 30–85 (dB) | 12 | 0.8 |
| Wind | 0.0001–25 (m/s) | 11 | 0.8 |
Wind cases only offer the wind ramp and the custom range. Their breaks are fixed at 25, 20, 15, 10, 8, 6, 4, 2 and 1 m/s.
Colouring buildings and uploaded data
Choosing スタイル opens a panel on the right. Under 塗り分け方法 (Fill mode) choose one of three:
- Solid colour
- One colour for everything, with 色 (colour) and 透明度 (opacity). A layer opens as white and opaque the first time.
- Colour by height (PLATEAU only)
- Colours buildings by height. Set the minimum and maximum (default 0–150 m), 段階数 (steps, 2–10, default 5) and the colours at each end; the height ranges are generated. Each range's value and colour can be edited, + adds one and × deletes one. Changing min, max, steps or colours regenerates the ranges and discards manual edits.
- Rules (uploaded data only)
- Colours by an attribute of your data. Each row has a colour, an attribute, an operator and a value. Operators are
=≠>≥<≤and 含む (includes). Rows are checked top to bottom and the first match wins; anything else gets the デフォルトの色 (default colour). 条件を追加 (Add condition) adds a row; rows with an empty value are ignored.
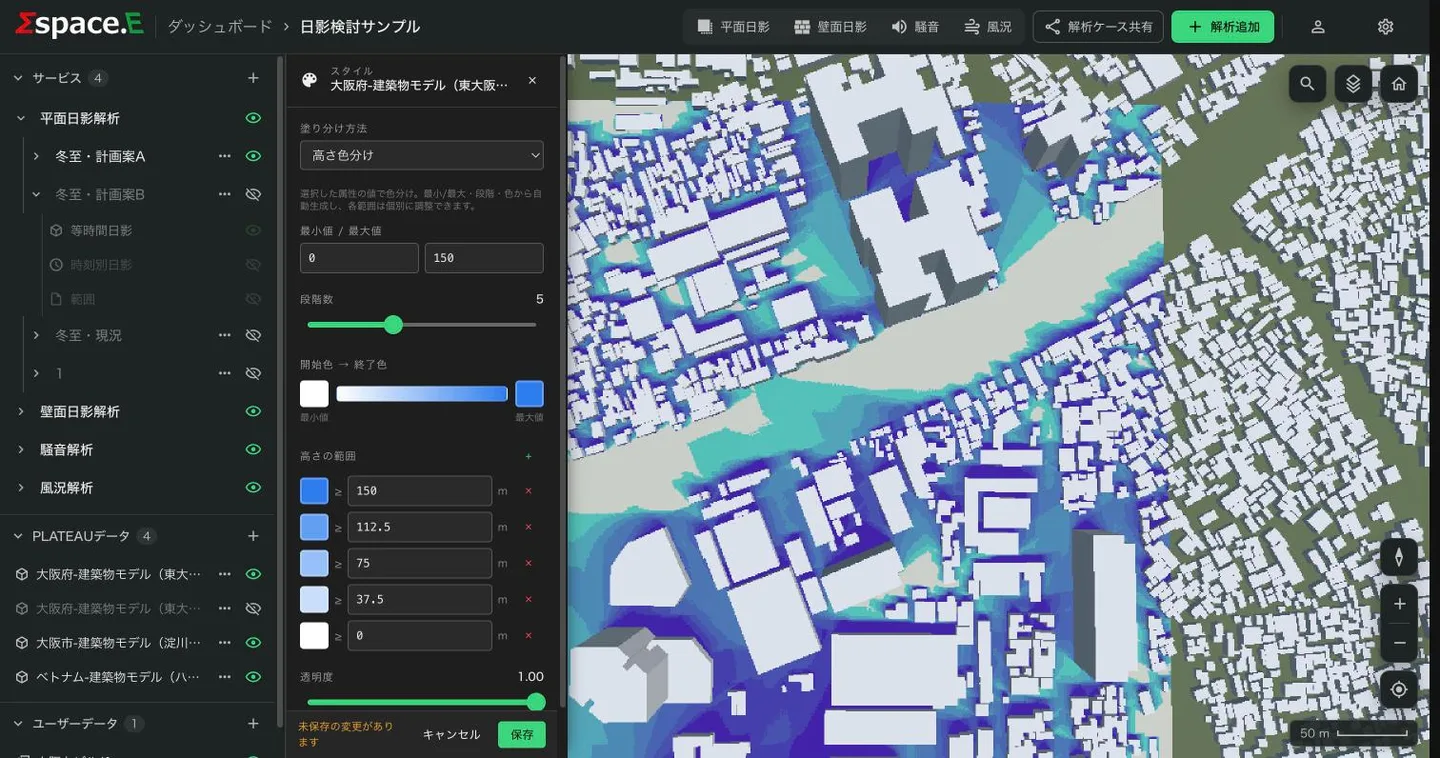
Click a swatch to open the colour picker. See-through is set with 透明度, not in the colour.
Press 保存 (Save) to apply it to the map; the map does not change while you edit. キャンセル (Cancel) returns to the saved state.
Hiding a building
Click a PLATEAU building on the map to open its attributes, then press 建物を非表示 (Hide building). Hidden buildings are listed under 非表示の建物 (Hidden buildings) in the スタイル panel; press the eye icon and 保存 to show one again.
Showing, hiding and inspecting
- The eye icon on each row shows or hides an analysis type, a case or a layer. The state is saved.
- Click a layer row inside a case to fly to it.
- Hourly shadow layers are grouped in one row; pick a time to show one at a time.
- Click a building or a result on the map to see its attributes (for results, the value and unit).